Our Articles brought to you by https://airdensityonline.com; all about density altitude, air density, water grains, altitude effects:
Air Density Tuning Elite 16 ProMods Drag Racing @ Texas Motorplex Nov. 1-3, 2018
https://www.racingjunk.com/news/2018/10/30/air-density-tuning-elite-16-promods-drag-racing-texas-motorplex-nov-1-3-2018/
Air Density Tuning at MLRA Lucas Oil Speedway Oval Track, April 12-13, 2019
https://www.racingjunk.com/news/2019/04/05/air-density-tuning-at-mlra-lucas-oil-speedway-oval-track-april-12-13-2019-presented-by-racingjunk-com/
Air Density Tuning for MWPMS ProMod Drag Race Cars at the Texas Motorplex’ Mello Yellow NHRA Fall Nationals
https://www.racingjunk.com/news/2019/10/15/air-density-tuning-for-mwpms-promod-drag-race-cars-at-the-texas-motorplex-mello-yellow-nhra-fall-nationals/
Air Density Tuning for MWPMS ProMod Drag Race Cars at the Texas Motorplex’ Mello Yellow NHRA Fall Nationals
https://www.racingjunk.com/news/2019/10/15/air-density-tuning-for-mwpms-promod-drag-race-cars-at-the-texas-motorplex-mello-yellow-nhra-fall-nationals/
Air Density Effects on Great Motorsport Races
https://www.racingjunk.com/news/2020/02/19/air-density-effects-on-great-motorsport-races/
Elevation and Atmospheric Factors in Motorsports Performance
https://www.racingjunk.com/news/2020/03/25/elevation-and-atmospheric-factors-in-motorsports-performance/
——————————————————-
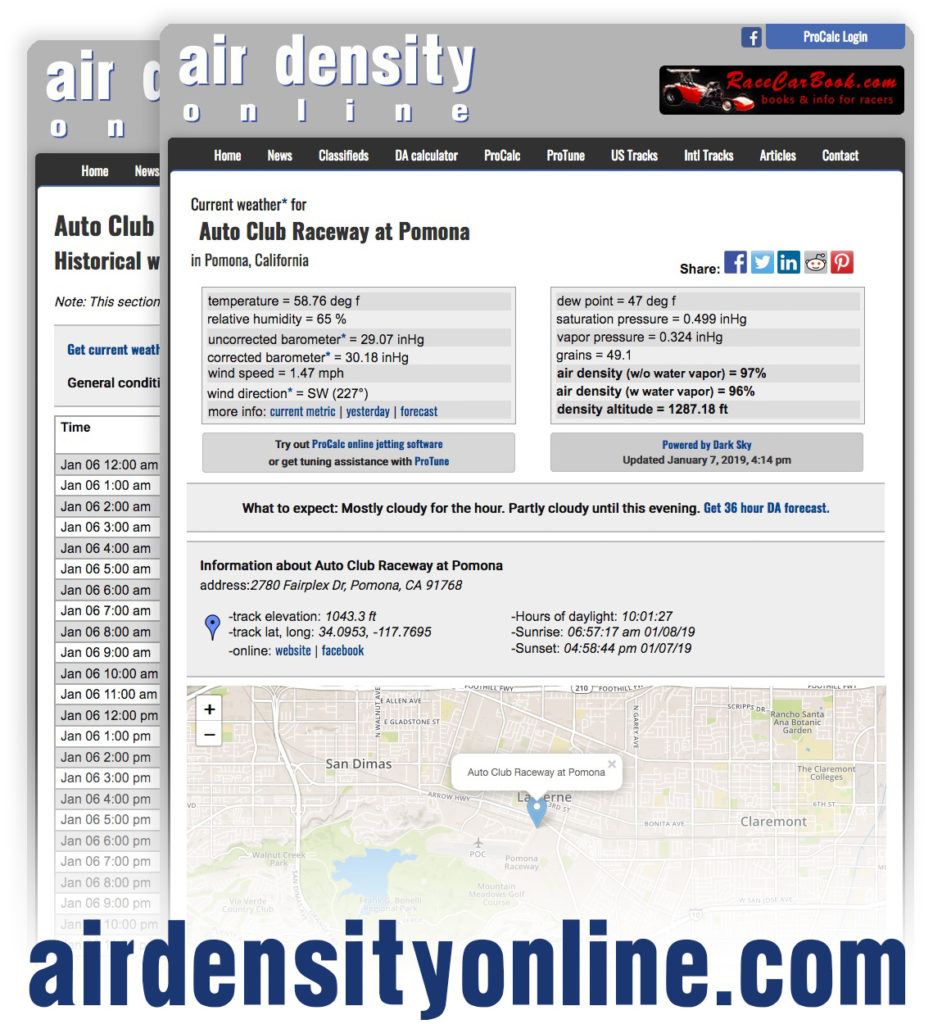
Did you know we developed a full site specifically for online racing weather? The site provides real-time, forecast, and historical weather variables including air density, density altitude, and grains of water.
Currently the site features over 600 race tracks worldwide including dragstrips, circle tracks, nascar, and karting. If your track isn’t listed, contact us and we’ll add it.
AirDensityOnline.com
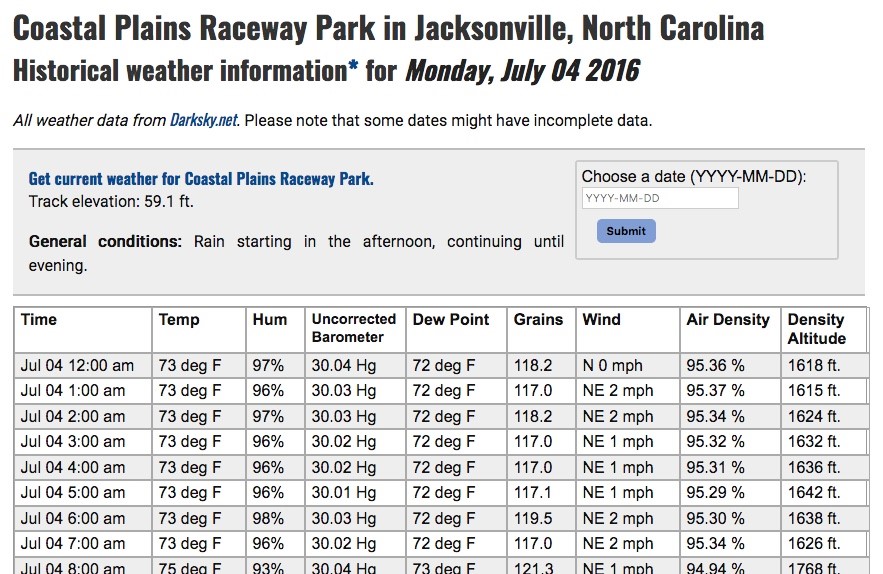
Example of historical weather, or weather from a past date.